Groups Digest
Overhauled the email digest pipeline, moving from unreliable cron jobs to priority queues, dedicated Redis infrastructure, and proper observability.
Freelancer Groups is a social feature serving 25M+ users: communities where freelancers post updates, share work, and collaborate. Each group generates activity that members receive as digest emails summarising what they missed.
Email digests sound simple. At scale they’re not. By mid-2025 the existing pipeline had reliability problems: worker OOM crashes on large groups, no separation between high-traffic and low-traffic groups, cron jobs with no log capture, and no visibility into whether emails were actually being delivered on time.
The overhaul covered the application code, the infrastructure underneath it, and the observability on top.
Pipeline
The digest processor was reworked to split jobs into priority and standard queues, so high-engagement groups get processed first rather than waiting behind the full backlog. An OOM guard filters inactive users (not seen in 90+ days) from large group digests; these were the jobs that had been crashing workers. Redis key fetching was narrowed to only the fields needed, and persistent RabbitMQ connections replaced per-job reconnects.
The whole pipeline is covered by a functional test suite that exercises the full path from job creation through to email output.
Infrastructure
The priority queue needed its own cluster, provisioned from scratch via with security groups, HAProxy routing, and TTLs on all keys to prevent unbounded memory growth. Cron execution was migrated to Nomad with full stderr/stdout capture, replacing fire-and-forget cron jobs that silently failed.
Observability
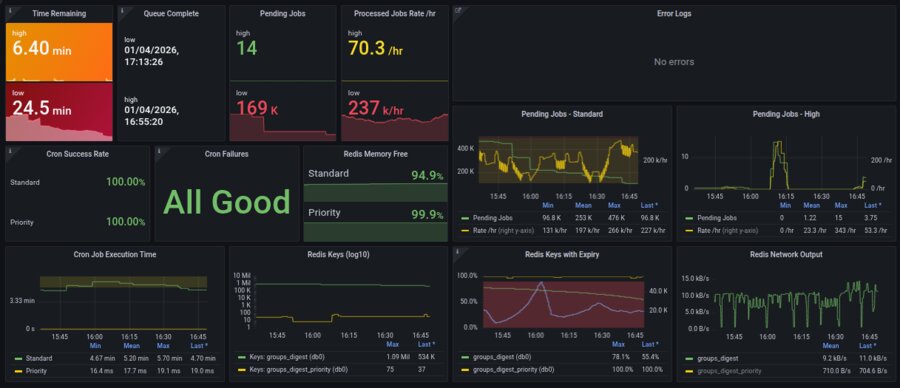
Grafana dashboard tracking the full pipeline: queue completion times, pending jobs, processing rates, cron execution, Redis memory and key counts, and error logs. Priority and standard queues are tracked independently.
A Prometheus and Alertmanager stack monitors the full pipeline: queue depth gauges, processing rate counters, cron success/failure tracking, Redis memory pressure, and key expiry rates. Alerts page on-call when queues stall or error rates spike.
What I find interesting about it
The tools here (priority queues, Redis, Nomad) are all standard. What was interesting was figuring out how long the original system had been silently broken. Cron jobs with no stdout capture give you nothing when they fail: no timestamp, no error, no indication that anything was wrong. The OOM crashes were leaving jobs half-processed with no record of where they stopped, so replay meant duplicates or gaps. A large chunk of the “members” being processed hadn’t logged in for 90+ days. Nobody had a clear picture of any of this because there was nothing to look at. Nomad, Prometheus, and Alertmanager didn’t make the pipeline faster in any meaningful sense: they made it observable. That’s what turned it from a system you hoped was working into one you could verify.