The NAS that kept us awake
Building JS projects in your home folder on a btrfs NAS generates tens of thousands of indexed files and hundreds of Docker layers. Read-write NVMe cache meant every Docker build burned through laptop SSDs that weren't rated for it.
Part of the homelab journey
See all phases →On this page
Homelab lesson of the day. Night and morning, literally. The first sign something was wrong was Rosie and I lying in bed hearing the working through the ceiling.
Two things went wrong simultaneously, which made diagnosing either one harder than it should have been.
The NVMe red herring
The first thing I actually noticed wasn’t the noise: it was the NVMe remaining life dropping in . Both drives had lost 2% in under a couple of weeks. Not a sustainable pace for OEM SK Hynix laptop SSDs that aren’t rated for sustained write cache workloads.
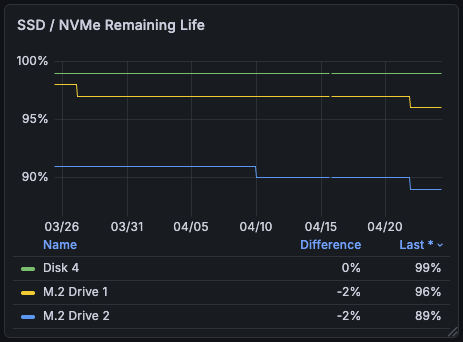
NVMe Remaining Life
Both M.2 drives down 2% in under a couple weeks. Not a sustainable pace.
I switched the NVMe cache from read-write () to read-only (RAID 0, double the capacity). That fixed the wear problem, but it’s when the noise started. volume1, the btrfs HDD array, began doing constant IO. For hours. Then a day. Then I started paying attention.
First thought: the NAS is priming the read-only cache. Reasonable assumption: it needs to populate the cache with hot data. But the NVMe read stats didn’t match. There wasn’t read volume on the NVMe drives to account for what the HDDs were doing. The HDDs were busy on their own.
No network involvement either. Nothing external was hitting the NAS. Whatever was generating this IO was local. Synology services doing work on the volume.
We’d been building cash-money (an app) for the past week or so, alongside the three Astro sites that already lived on the NAS. That’s a lot of npm installs, git pulls, and Docker builds landing on a btrfs volume. Were we generating snapshots? Was btrfs doing background reconciliation? Was indexing everything?
Time to actually look at the data.
What the disks were doing
Three Astro sites live in /var/services/homes/gread/. Each has a node_modules directory:
| Site | node_modules files |
|---|---|
| site-gread | 19,221 |
| site-peraga | 13,351 |
| site-rosie | 13,024 |
| Total | 45,596 |
45,000+ files sitting in the home folder, not counting build output, .git directories, or anything from the app builds.
Synology Drive indexes your home folder by default. Every npm install, git pull, and build triggered a cascade of file indexing IO across all three drives in the volume (sata1, sata2, sata3 running as an 8+8+2TB array).
# r/s rkB/s rrqm/s %rrqm r_await wkB/s %util ...$ sudo iostat -x 5 5 | grep sata3sata3 16.47 3650.27 677.98 97.63 51.24 221.58 17.25 ...sata3 16.40 232.80 41.80 71.82 71.21 14.20 232.00 ...sata3 5.60 86.40 16.00 74.07 76.75 15.43 90.60 ...The iostat was filtered to sata3, but the charts tell the full story across the volume.
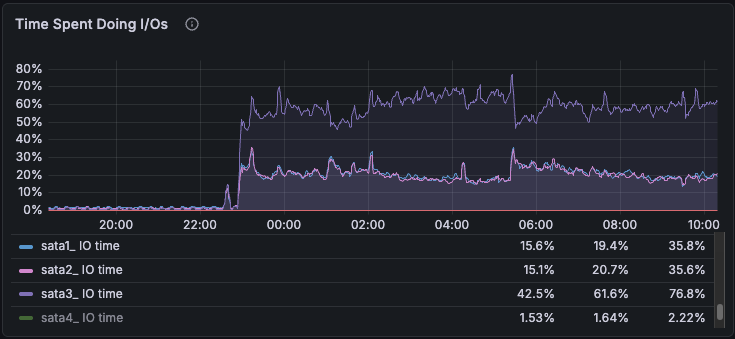
Time on IO
Same IOPS across all three drives, but sata3 at 60–80% utilisation while sata1 and sata2 sat at 20–30%.
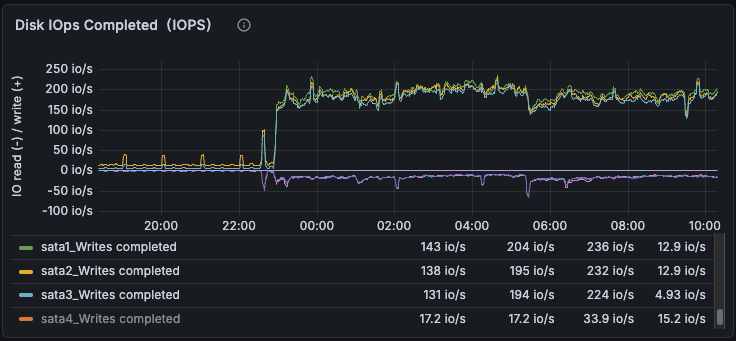
IOPS Completed
sata1, sata2, sata3 spike in lockstep at 22:00. That's the RAID volume taking writes together.
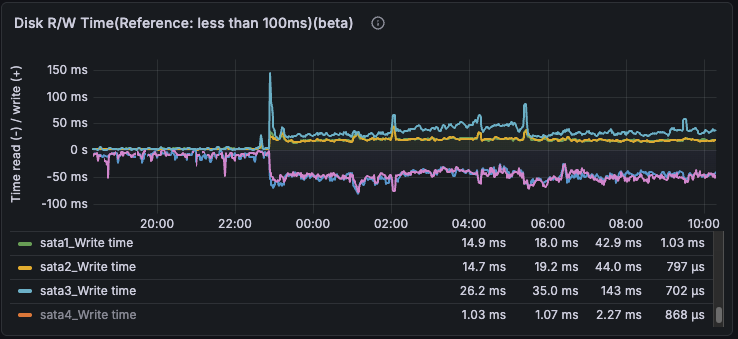
R/W Latency
Write latency elevated across the whole volume. sata3 worst at 26-143ms, sata1 and sata2 also elevated at 14-44ms.
Docker made it worse. With as the storage driver, stores each image layer as a btrfs subvolume or snapshot: base layers as subvolumes, each subsequent layer as a snapshot of the one below. I’d accumulated 350 of these over time. After pruning unused images, btrfs kicked off async deletion cleanup but only processed 11 of 350 before stalling. Two days later, 339 are still sitting there.
Two separate IO sources (btrfs snapshot cleanup and Synology Drive indexing) hammering the same RAID-5 volume simultaneously. That’s how you end up with the whole array saturated and spend hours blaming the wrong thing.
Why sata3 suffered more
The same work costs more on older hardware. That’s the whole story.
My initial assumption was that SHR was routing more writes to the 2TB drive. Wrong. Splitting write IOPS from total IOPS in settled it: node_disk_writes_completed_total and node_disk_written_bytes_total show all three drives receiving identical IOPS and identical throughput. SHR distributes the RAID-5 workload evenly.
The asymmetry is physical. The 2TB Hitachi (HUS724020ALA640, circa 2012) saturates at a lower IO rate than the 8TB Toshiba pair (MG08ADA800E, circa 2020) despite the same 7200 RPM spindle speed. Three things stack up:
Areal density. Both drives have 5 platters. The Hitachi stores ~400 GB per platter, the Toshiba ~1,600 GB. 4x the density means the Toshiba’s data is physically closer together on the surface, so shorter seeks for the same random IO pattern.
Sector size. The Hitachi uses 512-byte native sectors (512n). The Toshiba uses 4K physical sectors with 512-byte emulation (512e). A 4K write (which is what btrfs metadata and Synology Drive indexing generate) lands as one physical write on the Toshiba. On the Hitachi it can trigger a read-modify-write across 8 sectors: up to 3x the platter ops per logical write.
Cache. 256 MB on the Toshiba vs 64 MB on the Hitachi. At sustained random writes, the smaller cache fills and flushes to platter sooner.
At 200 write IOPS, sata3 runs a queue depth of 8–12 while the Toshibas sit at 4–6. Queue backs up, latency inflates 2–3x, utilisation hits 60–80% while the others cruise at 20–30%. Seven years of drive engineering, hitting from every angle at once.

Areal Density
Same 5 platters, 4x the capacity per platter. Denser data means shorter head travel for the same random IO pattern.

512n vs 512e Write Path
A single 4K write (btrfs metadata, Synology Drive indexing) lands as one op on the Toshiba. On the Hitachi it can trigger a read-modify-write across 8 physical sectors.
How SHR laid out the drives
cat /proc/mdstat tells the full story:
| Array | Level | Size | Drives | What |
|---|---|---|---|---|
| md0 | RAID-1 | 8 GB | sata1, sata2, sata3, sata4 | DSM system partition |
| md1 | RAID-1 | 2 GB | sata1, sata2, sata3, sata4 | Swap |
| md2 | RAID-5 | ~3.6 TB | sata1, sata2, sata3 | btrfs volume1 (data) |
| md4 | RAID-1 | ~1.8 TB | sata1, sata2 | 8TB pair only |
| md6 | RAID-1 | ~3.6 TB | sata1, sata2 | 8TB pair only |
| md5 | single | ~920 GB | sata4 | ext4 volume2 (SSD) |
| md3 | RAID-0 | ~480 GB | nvme0n1, nvme1n1 | Read-only cache |

SHR Array Layout
sata3's 1.8TB partition fills md2 entirely. The Toshibas contribute to three arrays. During the incident only md2 was active, but sata3 had nowhere else to spread the load.
sata3’s entire data contribution is md2. Once its 1.8TB partition is allocated, there’s nothing left to slice. The Toshibas contribute to md2 and md4 and md6.
During the incident, all the write activity was on md2, where Docker and my home folder live. md4 and md6 were idle. All three drives took equal hits, but sata3 was already the weakest link.
One thing that surprised me: Synology mirrors its system partition and swap across every installed drive, including sata4. Every drive is load-bearing for boot, even if its data lives in a separate pool. Not something I’d assumed.
Read-write NVMe cache was the wrong shape for this workload
I’d installed a RAID 1 NVMe cache pair thinking write caching would help. For a homelab NAS with a few users, it doesn’t.
Write caching only benefits high-frequency random writes, which isn’t what this setup does. Most workloads here are read-heavy: scraping, static site serving, thumbnail reads. ingests logs continuously but at homelab volumes the write IO barely registers, and reads only happen when actively querying in Grafana. The web-facing container volumes already live on an SSD anyway, not the btrfs HDD volume.
What the read-write cache did catch was Docker build layer writes. Every layer write during a build got pushed through the RAID 1 NVMe cache drives, which are OEM SK Hynix laptop SSDs, not rated for sustained NAS cache workloads. That’s what was burning through the drive life.
Switched to read-only cache (RAID 0, for double the capacity). The drives now do what they’re actually suited for: serving reads at 800 MB/s with a 95–99% hit rate.
What I’m doing about it
The fix for both comes down to the same thing: get the work off the wrong hardware.
Builds via . Where possible, builds run in CI and push to a self-hosted registry on the NAS rather than building locally. The registry is only reachable from CI via , with ACLs restricting it to the registry port only. GitHub’s free plan gives 2,000 minutes/month on Linux runners. Current usage here is about 17 minutes (Dependabot and a couple of recurring task workflows), so there’s plenty of headroom.
GHCR (GitHub Container Registry) is currently free for private container images (bandwidth included), so it's not the hard blocker it once was. The self-hosted registry still makes sense: local pulls are fast, and it's not subject to the free tier changing.
Docker data root moved to SSD. Moving Docker’s data root from the btrfs HDD volume to the 1TB SSD (volume2, confirmed ext4) switches the storage driver to overlay2 automatically. No subvolume accumulation. On DSM this means editing /var/packages/ContainerManager/etc/dockerd.json (/var/packages/Docker/etc/dockerd.json on older versions) rather than a simple flag, and Container Manager updates have a history of resetting it, so worth checking after each DSM upgrade. The 339 pending subvolumes on volume1 won’t clear on their own while the IO storm is running. btrfs-cleaner does async deletions but stalls under sustained load. I’ll remove them manually with btrfs subvolume delete once the migration settles. Nothing new will accumulate.
Git repos off the home folder. Moving clones out of /var/services/homes/gread/ means Synology Drive has nothing to index during builds. No indexing cascade, no unnecessary IO.
What stays on the HDD volume: the Immich photo library, because btrfs snapshots are actually useful there. Everything else that’s actively running moves to SSD.