WireGuard throughput: from 5 Mbps to saturating the link
Investigating why remote users were getting 5 Mbps through a WireGuard tunnel despite 400+ Mbps available on both ends. MTU fragmentation, TCP congestion collapse, and UDP buffer exhaustion.
Part of the homelab journey
See all phases →On this page
Remote users accessing my self-hosted instance (photos.gread.uk) were getting 2–5 Mbps throughput. The
architecture is straightforward:
graph LR
  subgraph internet[" Internet "]
    Client(["Client"])
  end

  subgraph vps["Helsinki: Hetzner VPS"]
    Nginx["nginx\nTCP proxy"]
  end

  subgraph wg[" WireGuard Tunnel "]
    direction LR
    WG1["10.8.0.1"] -. encrypted .-> WG2["10.8.0.2"]
  end

  subgraph home["London: Home Network"]
    Traefik["Traefik\nTLS termination"]
    Immich["Immich"]
  end

  Client -- HTTPS --> Nginx
  Nginx -- ":443" --> WG1
  WG2 --> Traefik
  Traefik --> Immich
Every link in the chain had plenty of bandwidth:
- Home upload: 433 Mbps
- VPS: 3,415 Mbps
- Test client in Italy: 213 Mbps
Something in the middle was the problem.
Ruling things out
| Suspect | Finding | Method |
|---|---|---|
| VPS bandwidth | 3,415 Mbps | speedtest-cli on VPS |
| Home upload | 433 Mbps | Cloudflare speedtest via Home Assistant |
| NAS CPU | 85.5% idle during transfers | Node exporter / Grafana |
| Disk speed | HDD vs SSD made no difference | DSM Drive download test |
| Encrypted share | Same speed as unencrypted | Comparative download |
| Immich application | Faster than DSM Drive | Comparative download |
None of these were the bottleneck. The problem was in the tunnel itself.
Root cause 1: MTU fragmentation
WireGuard interfaces on both VPS and NAS had the default MTU of 1420. Without explicit MTU configuration, packet fragmentation was happening at the WireGuard boundary causing TCP retransmits.
Evidence: TCP segment retransmits visible in node exporter metrics during transfers.
Fix: set MTU = 1280 on both ends to eliminate fragmentation.
# Added to [Interface] on both VPS and NAS wg0.confMTU = 1280Result: 5 Mbps → 53 Mbps (10x improvement). Better, but still well below what the link should support.
Root cause 2: TCP congestion collapse
iperf3 testing revealed asymmetric tunnel performance:
- NAS → VPS: 325 Mbps sustained, 0 retransmits
- VPS → NAS (uncapped): starts at 374 Mbps, collapses to ~160 Mbps average, 441 retransmits
The 60-second test showed periodic degradation every ~15–20 seconds: a cyclical bottleneck, not random congestion.
Node exporter metrics during sustained transfer:
| Metric | Idle baseline | During test |
|---|---|---|
| Context switches | ~12K ops/s | 88–131K ops/s |
| Interrupts | ~7K ops/s | 46–66K ops/s |
| Out-of-order queued | 1 p/s | 207 p/s |
| CPU 2 packet processing | baseline | 33.7K p/s vs 3–5K p/s on other cores |
Synology ‘s userspace WireGuard implementation pins network IRQ handling predominantly to CPU 2. Under high load, CPU 2 saturates, the packet queue fills, out-of-order packets accumulate, TCP backs off. When the queue drains, TCP recovers, hence the periodic oscillation.
Bandwidth threshold testing
| Cap | Avg achieved | Retransmits | Stable? |
|---|---|---|---|
| Uncapped | 165 Mbps | 672 | Collapse |
| 300 Mbps | 276 Mbps | 473 | Degrading |
| 250 Mbps | 231 Mbps | 151 | Partial |
| 200 Mbps | 200 Mbps | 115 | Short term |
| 150 Mbps | 142 Mbps | 132 | Sustained 60s |
150 Mbps was the sweet spot: below the IRQ saturation threshold, sustained reliably with minimal retransmits.
Fix: Linux traffic control (tc) token bucket filter on VPS wg0 interface.
tc qdisc replace dev wg0 root tbf rate 150mbit burst 1mb latency 400msWhy rate limiting improves real-world experience
Counterintuitively, capping at 150 Mbps outperformed uncapped (mean 165 Mbps) because uncapped oscillates between 180 and 90 Mbps, and video buffers stall during the collapses. Consistent throughput is more valuable than higher peak throughput for streaming workloads.
Result at this point: 5 Mbps → ~188 Mbps (37x improvement).
The second investigation: pushing further
With a structured experiment plan, I set up 120-second iperf3 baselines across four configurations (single/parallel streams, with/without tc shaper) and started working through the variables: MTU correction, RPS, tc cap tuning.
MTU correction
The 1280 MTU was overly conservative. PMTUD testing from VPS:
ping -M do -s 1380 10.8.0.2 # passping -M do -s 1400 10.8.0.2 # passping -M do -s 1412 10.8.0.2 # passping -M do -s 1420 10.8.0.2 # 100% packet lossCorrect MTU: 1412 + 28 = 1440. The gap from 1280 to 1440 was costing ~10% throughput per packet for no benefit.
UDP receive buffer exhaustion
Going through netstat metrics and building a dedicated Grafana dashboard for these tests, I found the real remaining
bottleneck: UDP buffer overflows on the NAS, tracked by the node_netstat_Udp_RcvbufErrors metric.
Synology’s defaults:
net.core.rmem_max = 212992 # 208 KBnet.core.netdev_max_backlog = 1000208 KB receive buffers trying to handle hundreds of megabits of WireGuard UDP traffic. The fix:
sudo sysctl -w net.core.rmem_max=26214400 # 25 MBsudo sysctl -w net.core.netdev_max_backlog=5000The result was immediate and dramatic. Fully saturated the connection. Single stream: 350+ Mbps sustained. Parallel streams: 430+ Mbps.
The Grafana dashboards tell the story clearly. Network throughput hitting the link ceiling:
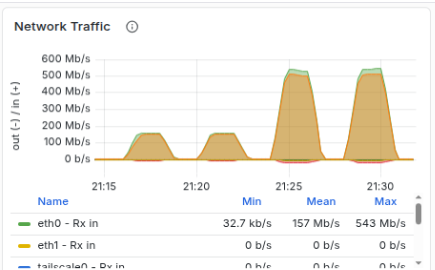 Single capped, 4x parallel, single uncapped, 4x parallel uncapped
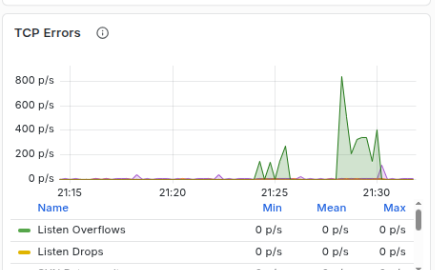
TCP errors remained low during the single uncapped test, but increased during the parallel tests. There was a single naughty stream that kept hitting the link ceiling and causing TCP congestion collapse for that link. 3 of 4 is pretty good in my eye.
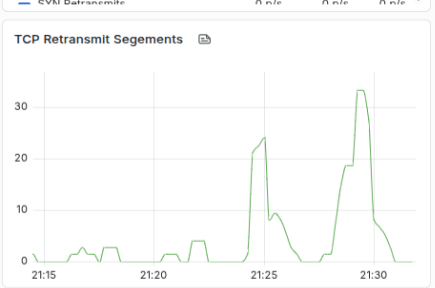
And retransmit segments echoing back the same data.
Final configuration
tc shaper on VPS raised to 450 Mbps to provide breathing room for competing parallel uploads:
tc qdisc replace dev wg0 root tbf rate 450mbit burst 32mb latency 400msThe same UDP buffer issue existed on the VPS (identical 212 KB defaults). After fixing both ends:
- Single stream NAS → VPS: 352 Mbps mean, 2 retransmits (down from 377)
- Parallel streams: 433 Mbps combined
No tc shaping needed on the NAS outbound. TCP self-regulates acceptably.
Summary
| State | Speed | Fix |
|---|---|---|
| Original | ~5 Mbps | n/a |
| After MTU fix (1280) | ~53 Mbps | Eliminated fragmentation |
| After tc rate limit (150 Mbps) | ~188 Mbps | Prevented IRQ saturation collapse |
| After MTU correction (1440) | ~200 Mbps | Recovered per-packet overhead |
| After UDP buffer fix (25 MB) | ~450 Mbps | Eliminated buffer exhaustion |
90x improvement from the original baseline. The final bottleneck is the physical fibre upload speed.
Monitoring
Key metrics to watch for regression:
# TCP retransmits (should stay low)rate(node_netstat_Tcp_RetransSegs[5m])
# wg0 receive throughputrate(node_network_receive_bytes_total{device="wg0"}[$__rate_interval]) * 8
# UDP receive buffer errors (should be zero)rate(node_netstat_Udp_RcvbufErrors[5m])